Documentation M3 record
M3 — Pong architecture proof#
Historical milestone record. M3 was accepted on 2026-08-11 against the Linux-x64-only scope of that date; that scope is superseded — Blitsen now publishes six desktop runtimes (Platform support). The Phase 1 "not yet cleared for redistribution" standing below is also superseded: releases 0.1.0–0.2.1 have since shipped with the notice flow that gate required. The acceptance harness itself still runs against the current runtime.
M3 was completed on 2026-08-11 on Linux x64, then the sole supported development target. The acceptance
application is examples/pong and contains exactly three application files:
index.html, style.css, and game.js.
The game has two-player keyboard control, pause and serve states, scoring, a first-to-seven win
condition, collision acceleration, and a live frame-rate readout. Its movement is driven only by
requestAnimationFrame; input arrives through DOM keydown and keyup listeners; every visual
change is a DOM style or text mutation.
Acceptance evidence#
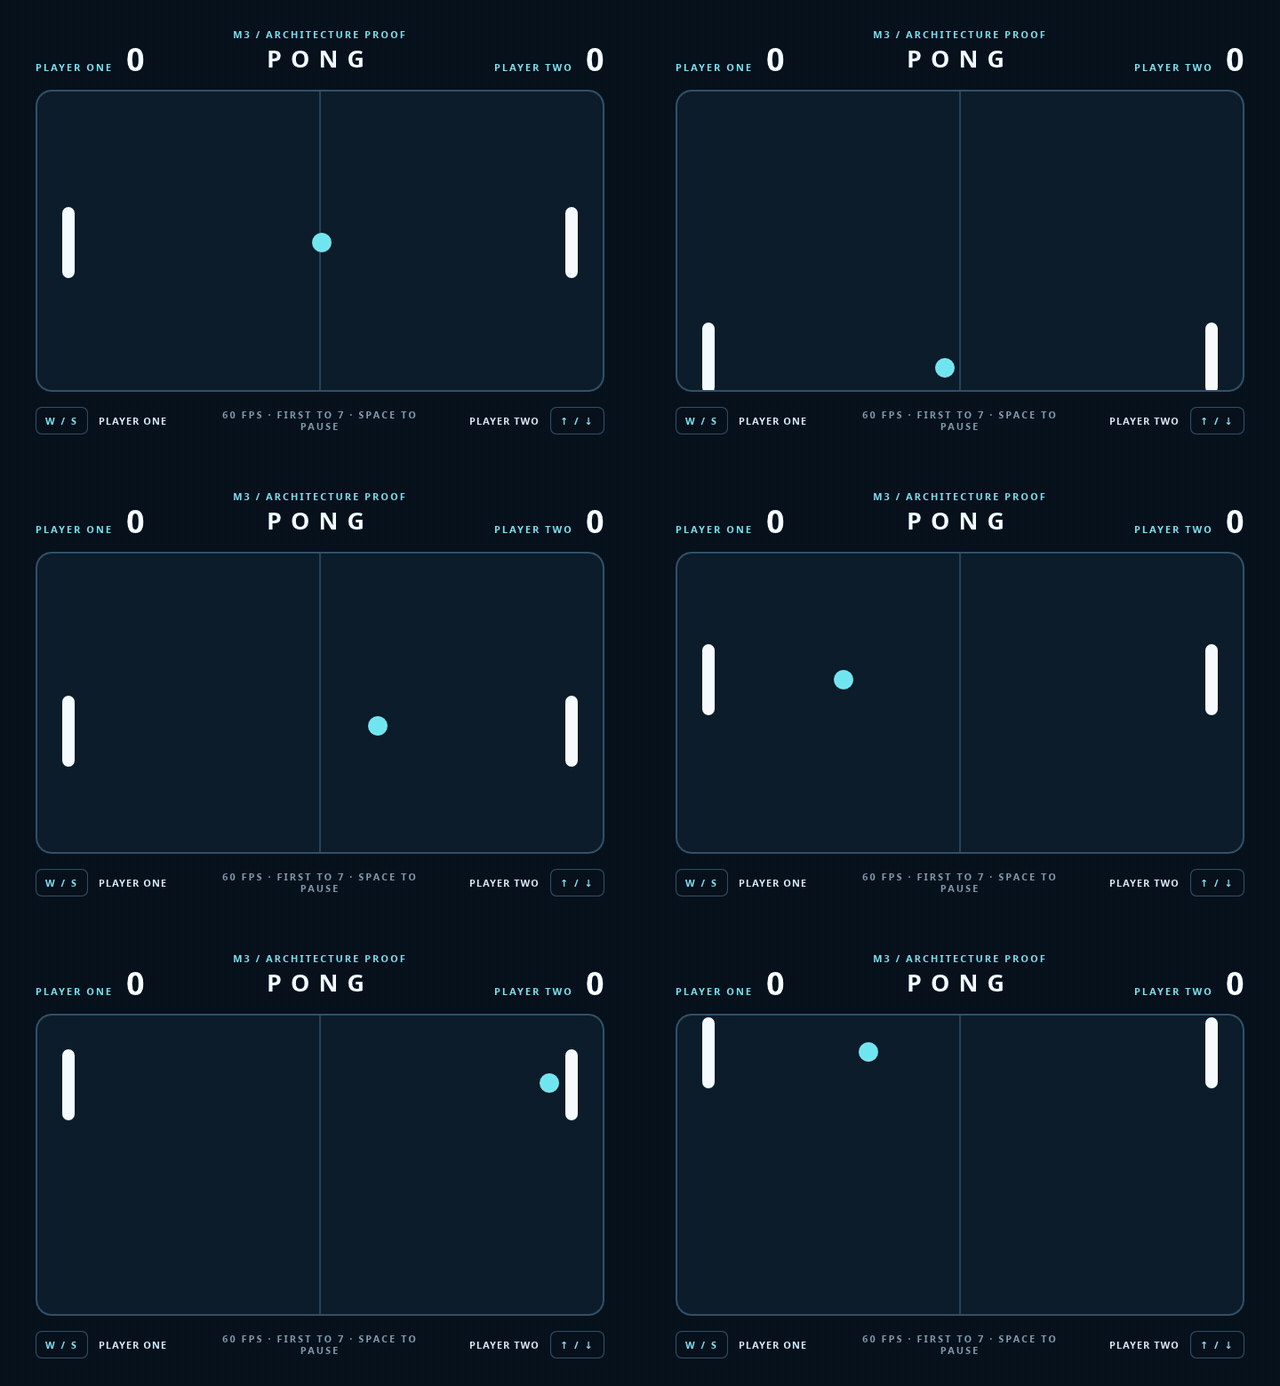
- The native document-animation harness serves the ball through an injected Space key, moves a paddle through an injected W key, advances 60 consecutive animation frames and observes the ball move. It also reads the game's own
#fpsreadout, which is not evidence of frame rate: the harness hands JavaScript a synthetic fixed timestep, and that readout is computed from those timestamps, so it reports 60 however slowly the frame actually ran. The frame rate claim rests on "Frame cost (P4)" below, which times the frame with the wall clock instead. blitsen build examples/pong --outfile Pongembeds the native Node-API host and all three files into one Bun-hosted executable. At launch it materializes the interpreted application payload in a private temporary directory, runs it, then removes that directory.bun run --cwd packages/blitsen test:standalonelaunches the compiled executable with an emptyPATH. Its headless gate loads the embedded native addon and executes the embedded document scripts without Bun, Node, Cargo, or source files available externally. When a display is available, the same test warms the renderer, pumps 120 measured native frames, and requires at least 58 fps (within one frame of the 60 Hz budget each second). That windowed assertion is currently failing — see "Frame cost (P4)" for the measurement and what it points at.
The Linux x64 standalone Pong artifact is a Phase 1 Bun-hosted measurement, not a Phase 2 production size target; M0 already withdrew the old numeric size target. Size is now tracked per commit rather than transcribed by hand — see "Measured metrics" below for the live baseline.
Measured metrics#
packages/blitsen/test/measure-export.mjs builds the standalone Pong export once and measures
size, startup and resident memory from that single artifact. Two consumers read the record:
run-size-gate.mjs enforces P1 against a committed baseline, and run-benchmarks.mjs appends
to a time series for P2 and P3. The CI job Size gate and benchmarks (headless) runs all three
and uploads the raw measurement as a build artifact; both reports are written to the job summary,
which is where a pull request's numbers appear.
export BLITSEN_RUNTIME_PATH="$PWD/target/release/blitsen-runtime"
bun run --cwd packages/blitsen measure --out measurements.json
bun run --cwd packages/blitsen size:gate --measurements measurements.json # fails on regression
bun run --cwd packages/blitsen bench --record  # appends to the committed series
bun run --cwd packages/blitsen bench:windowed  # needs a real desktop session
Size (P1)#
test/metrics/size-baseline.json holds the per-platform baseline and the regression threshold.
Installed and compressed sizes are recorded separately, compressed with gzip -9 for
comparability with the numbers in PRODUCT.md §9. The threshold is 2% — about
2.6 MB of the current artifact. That is wider than toolchain noise for a pinned Bun and a pinned
rustc, and narrower than any dependency or feature worth arguing about; the CI job pins both
toolchains for exactly this reason, so a compiler upgrade is a deliberate re-baseline rather than
a mystery failure. A shrink beyond the same threshold is reported too, because a stale baseline
silently widens the headroom the gate allows. Re-record with size:baseline when growth is
intended, and say why in the commit message.
The breakdown is derived, not estimated: the Bun runtime figure is a do-nothing entrypoint
compiled with the same bun build --compile, the addon and application figures are the files
that went in, and packaging is the remainder. On the recorded baseline the export is 71% Bun
runtime and 29% native addon; the application itself is 9.5 kB, which is the honest shape of a
Phase 1 artifact and the reason P1's numeric target is deferred to the Phase 2 host.
| component | bytes | share |
|---|---|---|
| Bun runtime | 94,582,912 | 71.3% |
native addon (libblitsen_node.so) | 38,133,744 | 28.7% |
application assets (examples/pong) | 9,535 | <0.1% |
| packaging | 2,769 | <0.1% |
| installed | 132,728,960 | |
gzip -9 | 47,872,185 |
Startup and idle RAM (P2, P3)#
Hosted runners have no display and noisy timing, so CI records and reports these but never fails on them. Two of the three numbers are proxies, named as such in the tool's output:
- Headless first paint — a proxy for P2. Spawn to exit of the exported executable under
BLITSEN_STANDALONE_CHECK, which loads the native addon, materializes the embedded application, parses it, runs its scripts and rasterizes one frame on the CPU. It is not a presented frame: there is no window, swapchain or GPU, and it additionally pays for the harness's DOM snapshot and PNG encode, which a real frame does not. - Headless peak RSS — a proxy for P3.
VmHWMof that same run. No window and no GPU allocations, so it is a floor for idle RAM rather than idle RAM. - Bun runtime floor. Spawn to exit of a do-nothing compiled executable, which separates what Bun costs to start from what Blitsen adds to it.
The real P2 and P3 numbers need a live desktop session and therefore a human: bench:windowed
times a one-frame windowed run and samples resident memory over five seconds of window life.
Those columns stay empty in the committed series until someone records them on a real display.
Recorded on Linux x64 (24-core dev machine, Bun 1.3.14, rustc 1.97.1), median of five runs after a discarded warm-up:
| metric | value | target |
|---|---|---|
| Bun runtime floor | 9.3 ms | — |
| headless first paint (P2 proxy) | 101.5 ms | P2 < 500 ms, real metric |
| headless peak RSS (P3 proxy) | 103,960,576 B | P3 < 100 MB, real metric |
The series lives in test/metrics/benchmark-history.jsonl, one JSON record per run, so drift is
visible across commits instead of only the latest snapshot. CI cannot push, so the committed
series grows from local runs; each CI run keeps its own record as an uploaded artifact.
Known gaps: only linux-x64 is measured, because it is the only supported target; the numbers
reach a pull request through the job summary rather than a posted comment; and the windowed P2
and P3 readings are not yet in the series.
Frame cost (P4)#
The 60 fps claim used to rest on the game's own #fps element. That number is circular: the
harness hands JavaScript a perfectly uniform synthetic timestep, and the readout is frame count
divided by those same timestamps, so it prints 60 no matter how long the frame really took.
bun run --cwd packages/blitsen frames replaces it. It replays the committed Pong input trace
through blitsen-core's FramePipeline with two clocks: JavaScript still receives the fixed
timestep, so the run stays reproducible, and each pipeline stage is timed with Instant, so a
slow frame shows up as a slow frame rather than as a slower simulation.
bun run --cwd packages/blitsen frames        # histogram, per-stage cost, DOM property cost
bun run --cwd packages/blitsen frames:audit  # the same, plus per-frame heap allocations
Recorded on Linux x64 (24-core dev machine, rustc 1.97.1, release build), Pong at 960x640, 120 frames of the committed trace, headless CPU rasterization:
| window | p50 | p95 | p99 | max | over 16.7 ms |
|---|---|---|---|---|---|
| all 120 frames | 0.809 ms | 0.936 ms | 1.439 ms | 6.259 ms | 0 |
| after the 10-frame warm-up | 0.807 ms | 0.934 ms | 1.298 ms | 1.299 ms | 0 |
Steady-state distribution: 107 frames at or under 1 ms, 3 between 1 and 2 ms, none above. The single 6.3 ms outlier is frame 1, which pays for font shaping and first-match style caches.
| stage | mean | share | allocations at the median frame |
|---|---|---|---|
| input | 0.013 ms | 1.5% | 0 |
| animation frame (JavaScript) | 0.044 ms | 5.1% | 147 |
| layout (style and layout, one Blitz pass) | 0.088 ms | 10.0% | 79 |
| paint (display list and CPU raster) | 0.739 ms | 83.4% | 774 |
| — of which the display list | 0.492 ms | ||
| async results, timers, microtasks, restyle, native viewport, submit, present | < 0.001 ms | 0.0% | 0 |
Frame cost is the sum of those stages. It excludes the harness's own per-frame digest and PNG
work, which costs about as much again (0.44 ms) and which no shipped frame pays. The allocation
column comes from a separate frames:audit build, whose timings agree with these within noise.
The stages are the ones blitsen-core's FrameStage has always declared. Until now nothing in
the workspace implemented FrameTurn outside that module's own unit-test mock, so the
instrumentation measured a test double while headless frames ran through an open-coded loop.
blitsen-node's frame_loop now implements it, and every headless frame — acceptance snapshots,
recorded demos, replays — turns through the pipeline, which is where these numbers come from. The
windowed host is still the exception: its later stages are inside the Blitz shell's redraw
handling, so pumpWindow() does not turn the pipeline and is not measured by it.
Several stages are structurally empty in the Phase 1 Bun-hosted loop rather than unimplemented:
Bun owns the timer queue and the microtask checkpoint, Blitz resolves style and layout in a single
pass that is charged to layout, and a headless CPU frame has no GPU queue and no swapchain. A
windowed frame trades the rasterizer for GPU submit and present, which cannot be measured without
a display.
A median frame makes 1,001 heap allocations, 265 kB, and frees 991 of them, and the audit says where: 774 in vello_cpu and blitz-paint, 147 in the animation callback (JavaScript mutating the DOM through the bridge), 79 in layout, 0 in the rest. The bytes scale with viewport area (134 kB at 320x240, 403 kB at 1920x1280) while the count does not, which places them in the rasterizer's tile and buffer handling. The loop's own per-frame allocations were removed: the image renderer and its pixel buffer are built once per run instead of once per frame, the animation callback is resolved once instead of compiling a fresh script every frame (which also cut that stage from 0.063 ms to 0.044 ms), and the pipeline no longer allocates a stage vector when instrumentation is off. What remains is inside Blitz and vello_cpu.
Not verified here: the windowed GPU path, and mid-range hardware. This is a 24-core workstation
and the issue asks for a mid-range machine, so what the measurement supports is a headroom
argument rather than a claim: the p95 frame uses 5.6% of the 16.7 ms budget, and 83% of that is
single-threaded CPU rasterization, so a machine with a sixth of this one's per-core throughput
would still hold 60 fps. Someone should still run frames on one.
The windowed loop sustains 60 fps on a real display. bun run --cwd packages/blitsen
test:standalone launches the compiled executable, warms the renderer, pumps 120 measured native
frames and reports 60 fps, stable across repeated runs. That number is wall clock — the harness
divides its own frame count by performance.now() deltas — so unlike the game's #fps readout it
measures something.
A caveat worth recording, because it cost real time: in an environment where DISPLAY is set but
X access does not actually work, Engine.pumpWindow() blocks for almost exactly 1000 ms per call
and the same assertion measures 1.0 fps. That is the wait deadline of a window that never becomes
presentable, not a frame-cost problem — the headless frame numbers above are from the same build.
If this assertion ever reports ~1 fps, check the display connection before the renderer.
DOM property cost (open technical question 4)#
This section answers TECH.md open technical question 4, which can be closed against it. Measured on the real Pong document, median of seven batches of 20,000 operations, microseconds per call:
| operation | µs | operation | µs | |
|---|---|---|---|---|
| plain JS object write | 0.051 | style.top = "..." | 3.37 | |
| plain JS object read | 0.005 | the same write, value unchanged | 3.14 | |
textContent write | 1.04 | the same, skipped by a JS-side guard | 0.005 | |
textContent read | 0.48 | style.top read | 1.41 | |
setAttribute | 1.69 | getElementById | 2.03 | |
getAttribute | 0.61 | getBoundingClientRect, clean layout | 10.5 | |
| Pong's three writes per frame | 11.2 | the same, after a style write | 66.8 |
Decision: no property cache on the JavaScript wrapper. Pong's animation callback writes four
inline style properties per frame, about 14 µs, which is 1.7% of a measured frame and 0.08% of the
60 Hz budget. A cache would buy that back at the cost of an invalidation surface — cssText,
setAttribute("style"), removeProperty, innerHTML and text replacement all have to invalidate
it — and a stale wrapper is a correctness bug, not a slow frame. Reads are not worth caching at
all: they are cheaper than writes and rarer.
Three things the numbers say for when this is revisited. A redundant write costs full price, so
the only cheap win is skipping it before the boundary is crossed, on the JavaScript side; doing it
in Rust would recover nothing, because the crossing has already been paid. The threshold is high:
an application would need to write on the order of a thousand properties per frame — 3.4 ms — for
this to matter at 60 Hz. And the read that actually hurts is the layout-dependent one:
getBoundingClientRect interleaved with a write costs 67 µs against 10 µs on a clean tree, which
is a read-after-write flush, not a bridge crossing. That is what __blitsenForcedLayoutsThisFrame()
already exists to catch.
Frame determinism (record and replay)#
bun run --cwd packages/blitsen test:determinism   # the gate
bun run --cwd packages/blitsen golden:record      # re-record after an intended change
test/replay/pong.trace.json is the committed input trace: format version, application, viewport,
frame count, the fixed timestep, a warm-up length, and synthetic events tagged with the frame they
are delivered in. They are dispatched at the same bridge entry points native input uses:
__blitsenDispatchKeyboardEvent, and __blitsenInjectPointerAt, which hit-tests the laid-out tree
before dispatching exactly as the window does. blitsen-core's replay module parses and
validates the trace; an unknown event type or an out-of-range frame is refused before anything is
dispatched.
Replaying produces three blake3 digests per frame, and they are not equally portable:
dom— every element's tag, attributes, inline style and text. This is only what the application wrote, so it is identical on any machine.layout— every element's resolved box. Text-sized boxes depend on the installed fonts.pixels— the rasterized RGBA frame. Depends on fonts and on which SIMD path vello_cpu picks for this CPU.
So the gate has two tiers. renderEnvironmentFingerprint() digests a fixed text-and-shape fixture
rendered through the same pipeline; two machines that agree on it agree about rasterization. The
golden records the fingerprint it was captured under. Where it matches, all three digest sequences
are compared against the golden; elsewhere only dom is, and the other two are reported as
recorded-but-not-gated. Either way the trace is replayed twice, in separate processes, and all
three sequences must agree between the two runs — that is the check that catches real
nondeterminism, and it holds on every machine.
On divergence the run fails, re-renders the first eight diverging frames as PNGs into
target/determinism-divergence/, and the CI job Frame determinism (headless) uploads that
directory as a build artifact. The same job records the P4 frame report described above and
uploads it; timing never fails the build, because a hosted runner is too noisy to gate on.
Known gaps: the golden is linux-x64 only, and the hosted runner's fonts differ from this
machine's, so CI gates the dom sequence and the cross-process agreement, not the committed
pixels. A second machine with the same fingerprint, or a bundled font, would close that.
Phase 1 executables remain internal architecture proofs. They are not yet cleared for
redistribution because the automated third-party notice and JSC relinking gate in
LICENSING.md is not implemented.